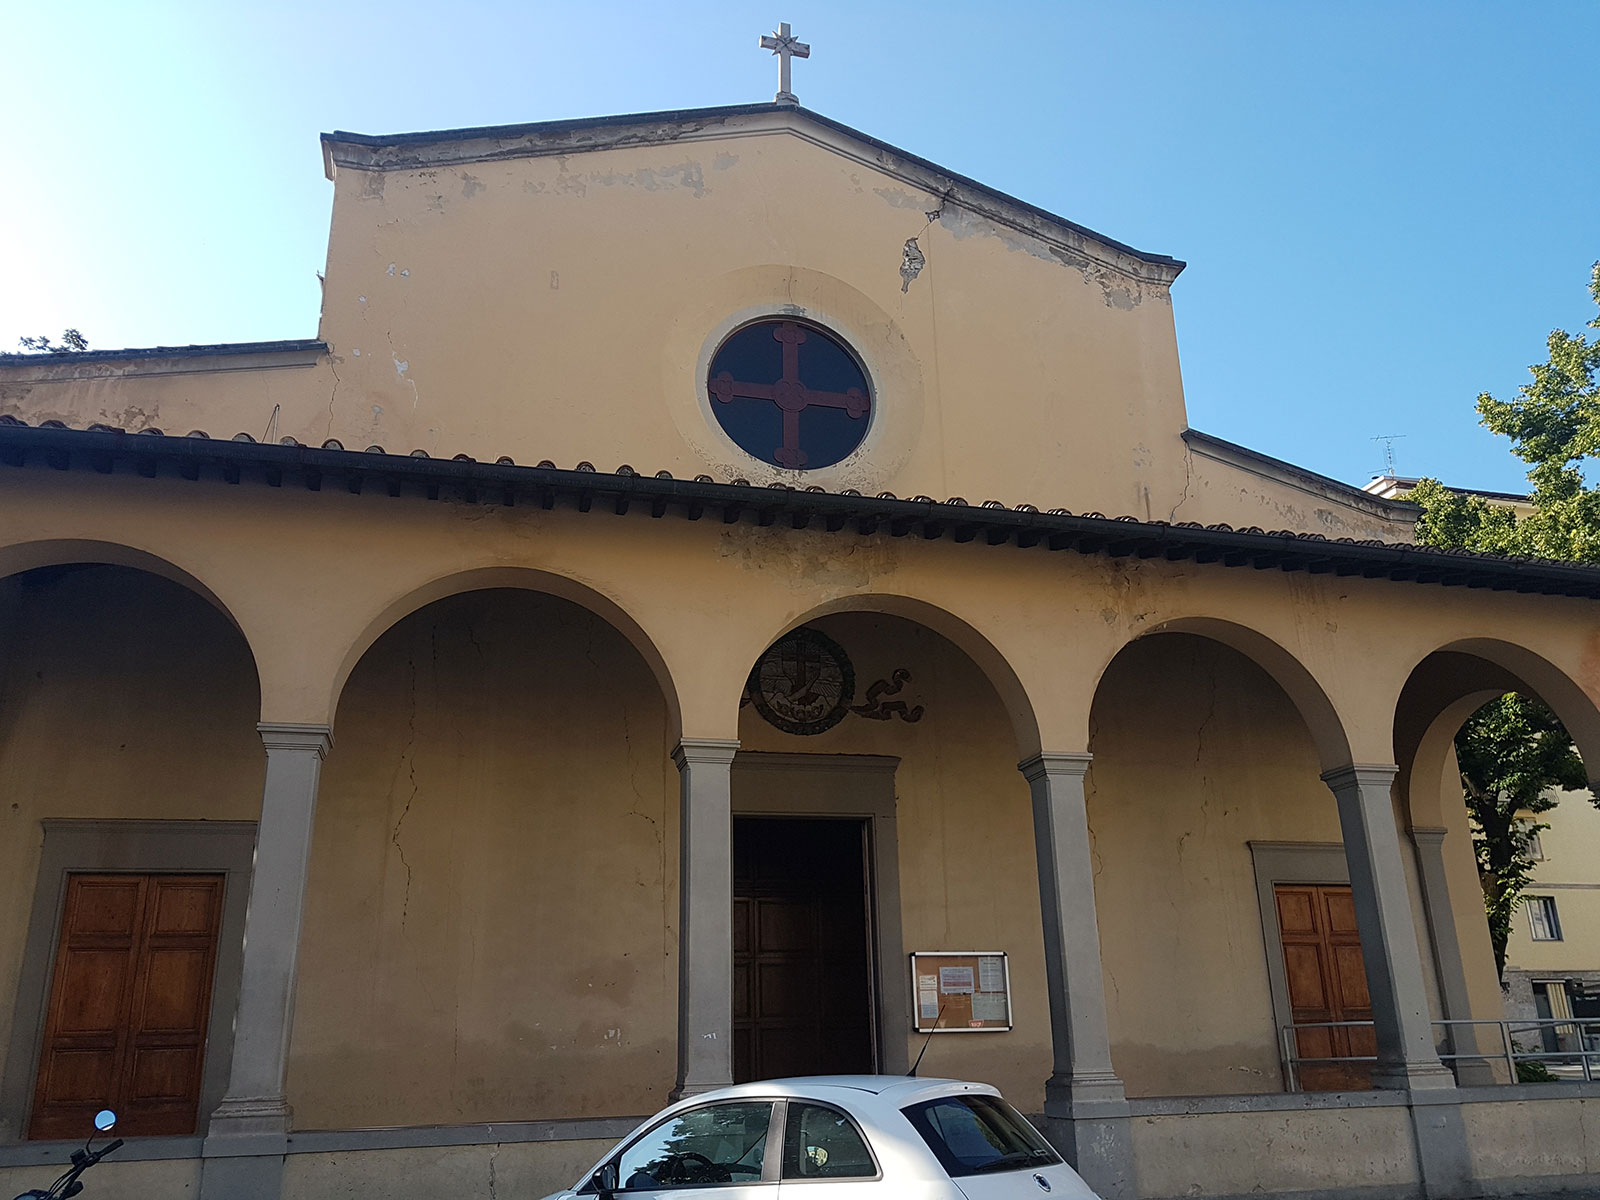
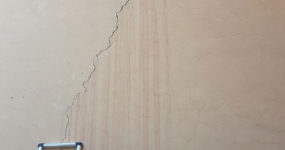
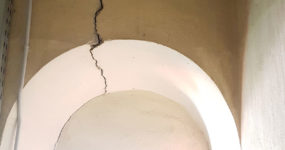
The structural health monitoring is appropriate for the control and study of cracks in some rooms of the Parish of the Sacred Heart at Romito.
In particular, this monitoring is necessary: in the current phase, to acquire the status of fact and record the various movements, during consolidation and restoration work planned to verify the effects of the same and keep the work under control during the most invasive phases. Finally for a period following the execution of the work to verify its success.
IoT technologies are used to manage data from sensors. These allow remote monitoring, providing near real-time data on the TERTIUM web platform, accessible through any browser, and allowing through the latter to manage a real-time alert system, designed to directly alert technicians if an anomalous value is recorded.
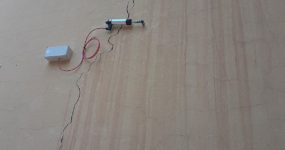
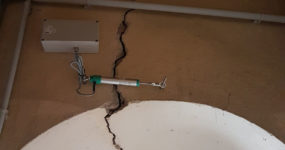
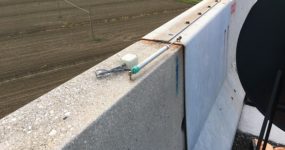
For the control of the main cracks, during the implementation of the consolidation and restoration operations, 5 mono-directional electric crackers are currently used. These sensors are generally used for the control of surface cracks in buildings, civil works or historical works, openings in the ground, monitoring of structural joints in dams, bridges or artefacts. This model of crackmeter combines excellent strength, high resolution and sensitivity.
The frequency of automatic readings can be decided in the activation phase and in any case, can be modified later according to specific needs. The threshold management system, upon exceeding which an alarm message is generated, is very flexible: in fact, it allows to set different thresholds for each device and to select the person or group of people to whom a specific alarm must be addressed.
Thanks to the IoT technologies used in this monitoring system, the sensors are able to acquire and send data directly to the Cloud of the TERTIUM monitoring platform.
All data and measurements will be stored, managed and consulted directly on the web, using any browser from any device (PC, Tablet, Smartphone), without any need to install specific software.
Through the monitoring platform, the sensors will be uniquely indexed on a geo-referenced map and the measurements will be displayed both in graphical and numerical format.
All data and measurements can also be downloaded in standard graphical or numerical formats (.pdf, .png, .csv) for the management of particular needs.
We thank Pizzi Terra for making this monitoring possible.
You must be logged in to post a comment.